How to Build Real-Time JavaScript React Maps with GeoJSON – No SVG Bottlenecks
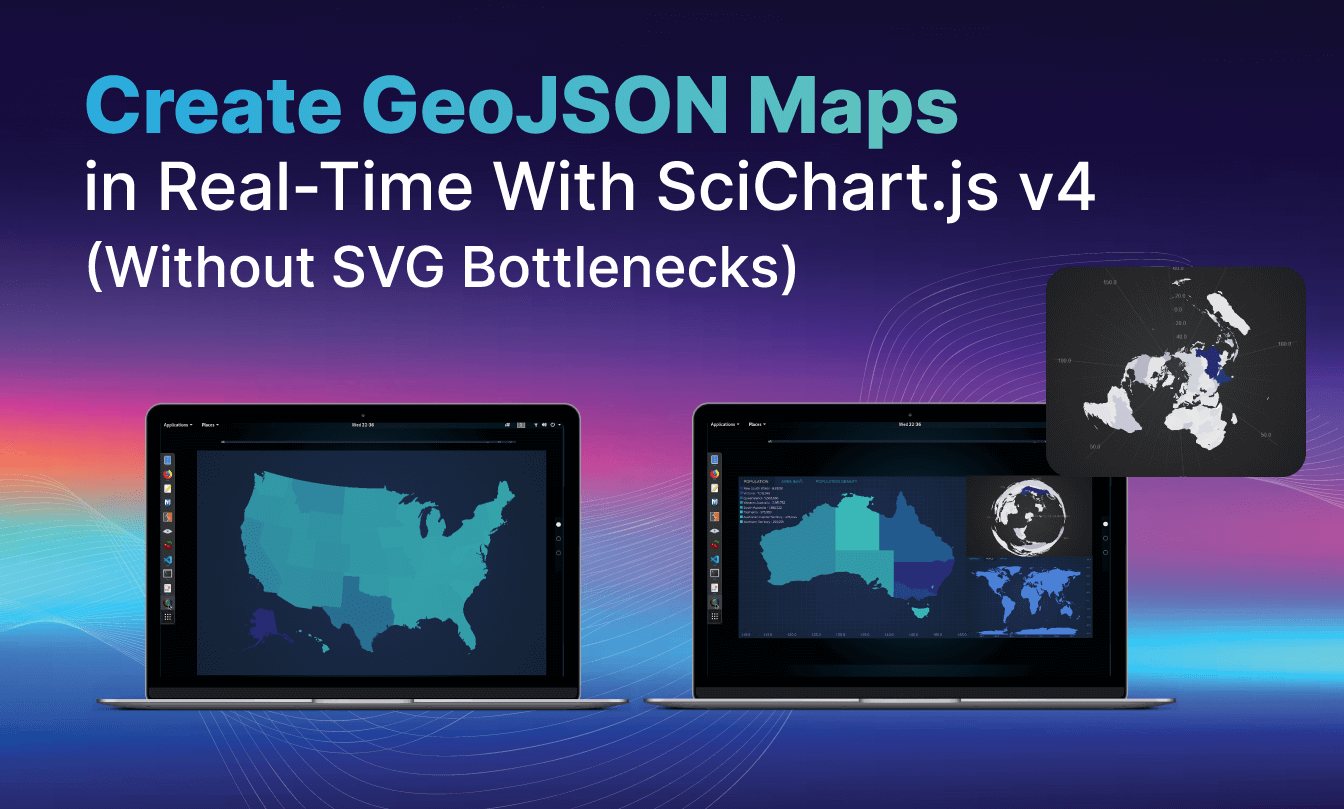
High-performance real-time GeoJSON maps with SciChart.js v4 support fast, customizable choropleth maps and spatial visualizations.
If you're processing GeoJSON and rendering triangle meshes in the browser, you've likely hit the ceiling with SVG or Canvas. SciChart.js v4 breaks through that bottleneck and unlocks a new layer of performance for teams building data-intensive visualizations.
At launch, the first examples we've implemented are all variations of choropleth maps, where geographic regions are shaded or colored based on a data value such as population density, signal strength, or sensor readings. Choropleth maps are ideal for spatial dashboards, and with SciChart's WebGL-based rendering, you get a fluid, high-performance experience even with complex geometries or large datasets.
🚀 What's New in SciChart.js v4
With SciChart.js v4, there are plenty of new features we're excited to share with our community of developers that enable you to break through the SVG bottleneck. From a new TriangleRenderableSeries to smarter render batching for redrawing, explore the latest updates that SciChart has to offer, and how they can help you build complex GeoJSON maps faster and better.
👉 See the SciChart.js v4 announcement on LinkedIn
TriangleRenderableSeries
Our GPU-accelerated TriangleRenderableSeries lets you render arbitrary triangle meshes (e.g. triangulated GeoJSON) via WebGL, with support for:
Direct vertex/index buffer input
Native speed display
Custom projections, including polar, stereographic, orthographic and custom, without a rendering penalty
Hundreds of thousands of triangles at 60+ FPS
We're not accelerating the parsing or triangulation. We're accelerating the rendering of arbitrary triangles.
RectangleRenderableSeries
Using the RectangleRenderableSeries, you can render layout-driven visuals like treemaps, allocations and spatial grids, all GPU-accelerated and interactive.
Performance + API Upgrades
With SciChart.js v4, you'll benefit from smarter render batching for redraw-intensive scenes, dynamic z-ordering for layered charting, and full control over colors, vertex transforms, and coordinate space.
Advanced Dashboards
With advanced dashboards, you can effortlessly create treemaps, data tiling layouts, and spatial relationship charts. Developers can also merge geometric and business data into highly customized, renderable layers.
The examples below, including a triangulated USA map, showcase choropleth-style visualizations rendered via SciChart's GPU engine. While they resemble traditional maps, each is built on WebGL with real-time rendering performance and deep extensibility, ideal for interactive dashboards, spatial analytics, and high-volume geospatial data.
Real-World Use Cases (Where It Shines)
Now that you know what is being added to our repertoire of expansive, customizable and high-performance features, it's worth showcasing where these new features were designed to shine. While this is not an exhaustive list, it covers some of the core sectors that can benefit from these new features and upgrades.
Oil & Gas

Overlay seismic data, survey zones, and projected well locations over triangulated maps Visualize intricate geological structures by integrating seismic interpretations, precisely delineated survey boundaries, and future well paths directly onto dynamic triangulated maps. This gives a comprehensive understanding of subsurface conditions, aiding exploration and development decisions. The triangulated maps provide a robust foundation for accurate spatial referencing, so all overlaid data is rendered with high precision and clarity.
Use polar or UTM projections without rendering lag Switch between polar and Universal Transverse Mercator (UTM) projections with no noticeable rendering lag, keeping the user experience smooth and responsive. This is vital for applications requiring global coverage or highly localized precision.
Animate telemetry on top of spatial regions Bring your data to life by animating real-time telemetry feeds directly onto predefined spatial regions. This lets you track moving assets, environmental changes, or operational progress in a geographical context. Whether monitoring vehicle movements, sensor readings, or natural phenomena, animated telemetry provides valuable insight into temporal patterns and spatial relationships.
Aerospace & Defense

Render live positional data, terrain overlays, or mission planning visuals
Imagine a fleet management system where the exact location of vehicles needs to be displayed instantly on a map. As each vehicle transmits its updated coordinates, the GeoJSON data changes, and the map must reflect these changes in real time, giving an accurate, up-to-the-minute overview of the entire fleet's movements.
Beyond simple points, real-time rendering also supports complex terrain overlays. This could mean displaying dynamic weather patterns that update in real time to show precipitation, wind speeds, or temperature changes. Overlaying this constantly changing data onto a base map provides critical insight and situational awareness.
Another significant area is mission planning. In defense, logistics, or drone operations, real-time map updates are essential for dynamic mission planning: visualizing changing no-fly zones, updating routes based on new intelligence, or displaying the live progress of ground or airborne assets. Instant feedback on the map allows for rapid adjustments and better decisions during critical operations.
Display vector-based operational maps that update in real time
Unlike static raster images, vector maps are made of geometric primitives like points, lines, and polygons, which gives crisp rendering at any zoom level and easier manipulation of individual features. In operational contexts, boundaries, infrastructure, or strategic points can be added, modified, or removed instantly as circumstances change, so users always have the most accurate and actionable view of their operational environment.
Climate & Remote Sensing
▶️ Watch the demo: real-time GeoJSON climate map in SciChart.js v4
Visualize Temperature Gradients, Radiation Models, or Global Sensor Coverage
Real-time GeoJSON map rendering makes it possible to visualize intricate climate and remote sensing datasets with clarity and responsiveness. For example:
Temperature gradients: Observe subtle shifts in thermal energy across vast areas, enabling analysis of climate patterns, urban heat islands, or the spread of wildfires. The map becomes a living thermometer, giving immediate feedback on environmental change.
Radiation models: Track the distribution of radiation from natural sources, industrial emissions, or emergency situations. This is crucial for public safety, environmental monitoring, and disaster response, allowing real-time assessment of potential risks.
Global sensor coverage: Get a full overview of sensor networks, identify coverage gaps, monitor device health, and optimize data collection. From environmental sensors to traffic monitoring systems, the map becomes an interactive dashboard for interconnected systems.
Use Polar Projection with Tens of Thousands of Triangles from MODIS-Style Datasets
Combining the precision of GeoJSON with advanced rendering lets users explore and analyze complex geospatial information dynamically, across fields from scientific research and environmental monitoring to logistics and urban planning. Capabilities we're unlocking for developers include:
Polar projection: Represent global phenomena accurately in polar regions. This is particularly important for the Arctic and Antarctic, where traditional Mercator projections distort heavily.
Tens of thousands of triangles: Render detailed topographical features, atmospheric conditions, or scientific models made of vast numbers of data points, with the granularity to show intricate geometries and nuanced data.
MODIS-style datasets: Incorporate data from sources like the Moderate Resolution Imaging Spectroradiometer (MODIS), a key instrument aboard NASA's Terra and Aqua satellites. These datasets, known for extensive coverage and high temporal resolution, can show processes from vegetation health to sea surface temperature.
Telecom & Smart Cities
Display infrastructure coverage, signal strength, or failure overlays by geographic zone
For telecoms companies, utilities, and emergency services, understanding the real-time status of infrastructure is crucial. Picture cellular signal strength mapped across neighborhoods to pinpoint weak coverage, or a power grid operator instantly identifying zones affected by outages for rapid response. Civil engineering firms can overlay structural integrity or environmental impact data across specific building zones. This supports proactive maintenance, efficient resource deployment, and improved public safety through an immediate visual view of operational status.
Integrate Real-Time Sensor Data with Geographic Awareness
The Internet of Things (IoT) has led to an explosion of sensor data, much of it with a geographic component. Integrating this data with GeoJSON maps enables powerful spatial analysis and real-time monitoring. For instance:
Environmental agencies can track air quality or water pollution from distributed sensors and identify pollution hotspots in real time.
In agriculture, sensors monitoring soil moisture or crop health can be visualized geographically, enabling precision farming.
Urban planners can track traffic flow or pedestrian movement to inform infrastructure development or event management.
This moves beyond static maps, turning them into dynamic dashboards that reflect real-world activity and give decision-makers actionable insight.
Transport & Logistics
Show dynamic fleet locations, congestion heatmaps, and route planning overlays Real-time fleet locations, congestion heatmaps, and route planning overlays can all be built with GeoJSON charts in SciChart.js v4. This supports optimized logistics, better delivery times, and proactive responses to unexpected delays.
Combine static base layers with real-time, triangle-driven data overlays With SciChart.js v4, you can combine static base layers with real-time, triangle-driven data overlays to visualize complex transport and logistics data such as vehicle movements, supply chain routes, and delivery statuses.
TL;DR: How SciChart.js Supports Complex GeoJSON Maps in Real Time
Using SciChart's JavaScript chart library means you can stop pushing SVG to its limits:
Feed your triangles into
TriangleRenderableSeriesRender on the GPU with native performance
Apply custom projections without writing rendering logic
Build real-time, scalable, interactive visuals that respond instantly
Traditional rendering techniques can struggle with performance and cause lag. Rich, geographically aware visualizations need to be not only accurate but also responsive and accessible for critical operational and analytical tasks.
SciChart.js v4 isn't just faster. It's built for the next generation of data-driven apps.
Building on this, the SciChart React Chart Library brings the same next-generation performance to modern web apps. With seamless React integration, it makes it easy to create fast, interactive, and visually rich charts for any data-driven experience.
About the author
- Dr. Andrew Burnett-Thompson is a software entrepreneur, expert software architect, and technical leader. As the Founder and CEO of SciChart, an advanced cross-platform chart library, he is recognized as an industry expert in high-performance computer graphics, .NET/WPF architecture, UI frameworks, and real-time visualization systems. His work bridges the gap between complex mathematical data and ultra-fast visual rendering, enabling developers worldwide to build high-performance applications for medical, financial, aerospace, and motorsport industries.
Comments
Join the discussionNo comments yet. Be the first to comment.